
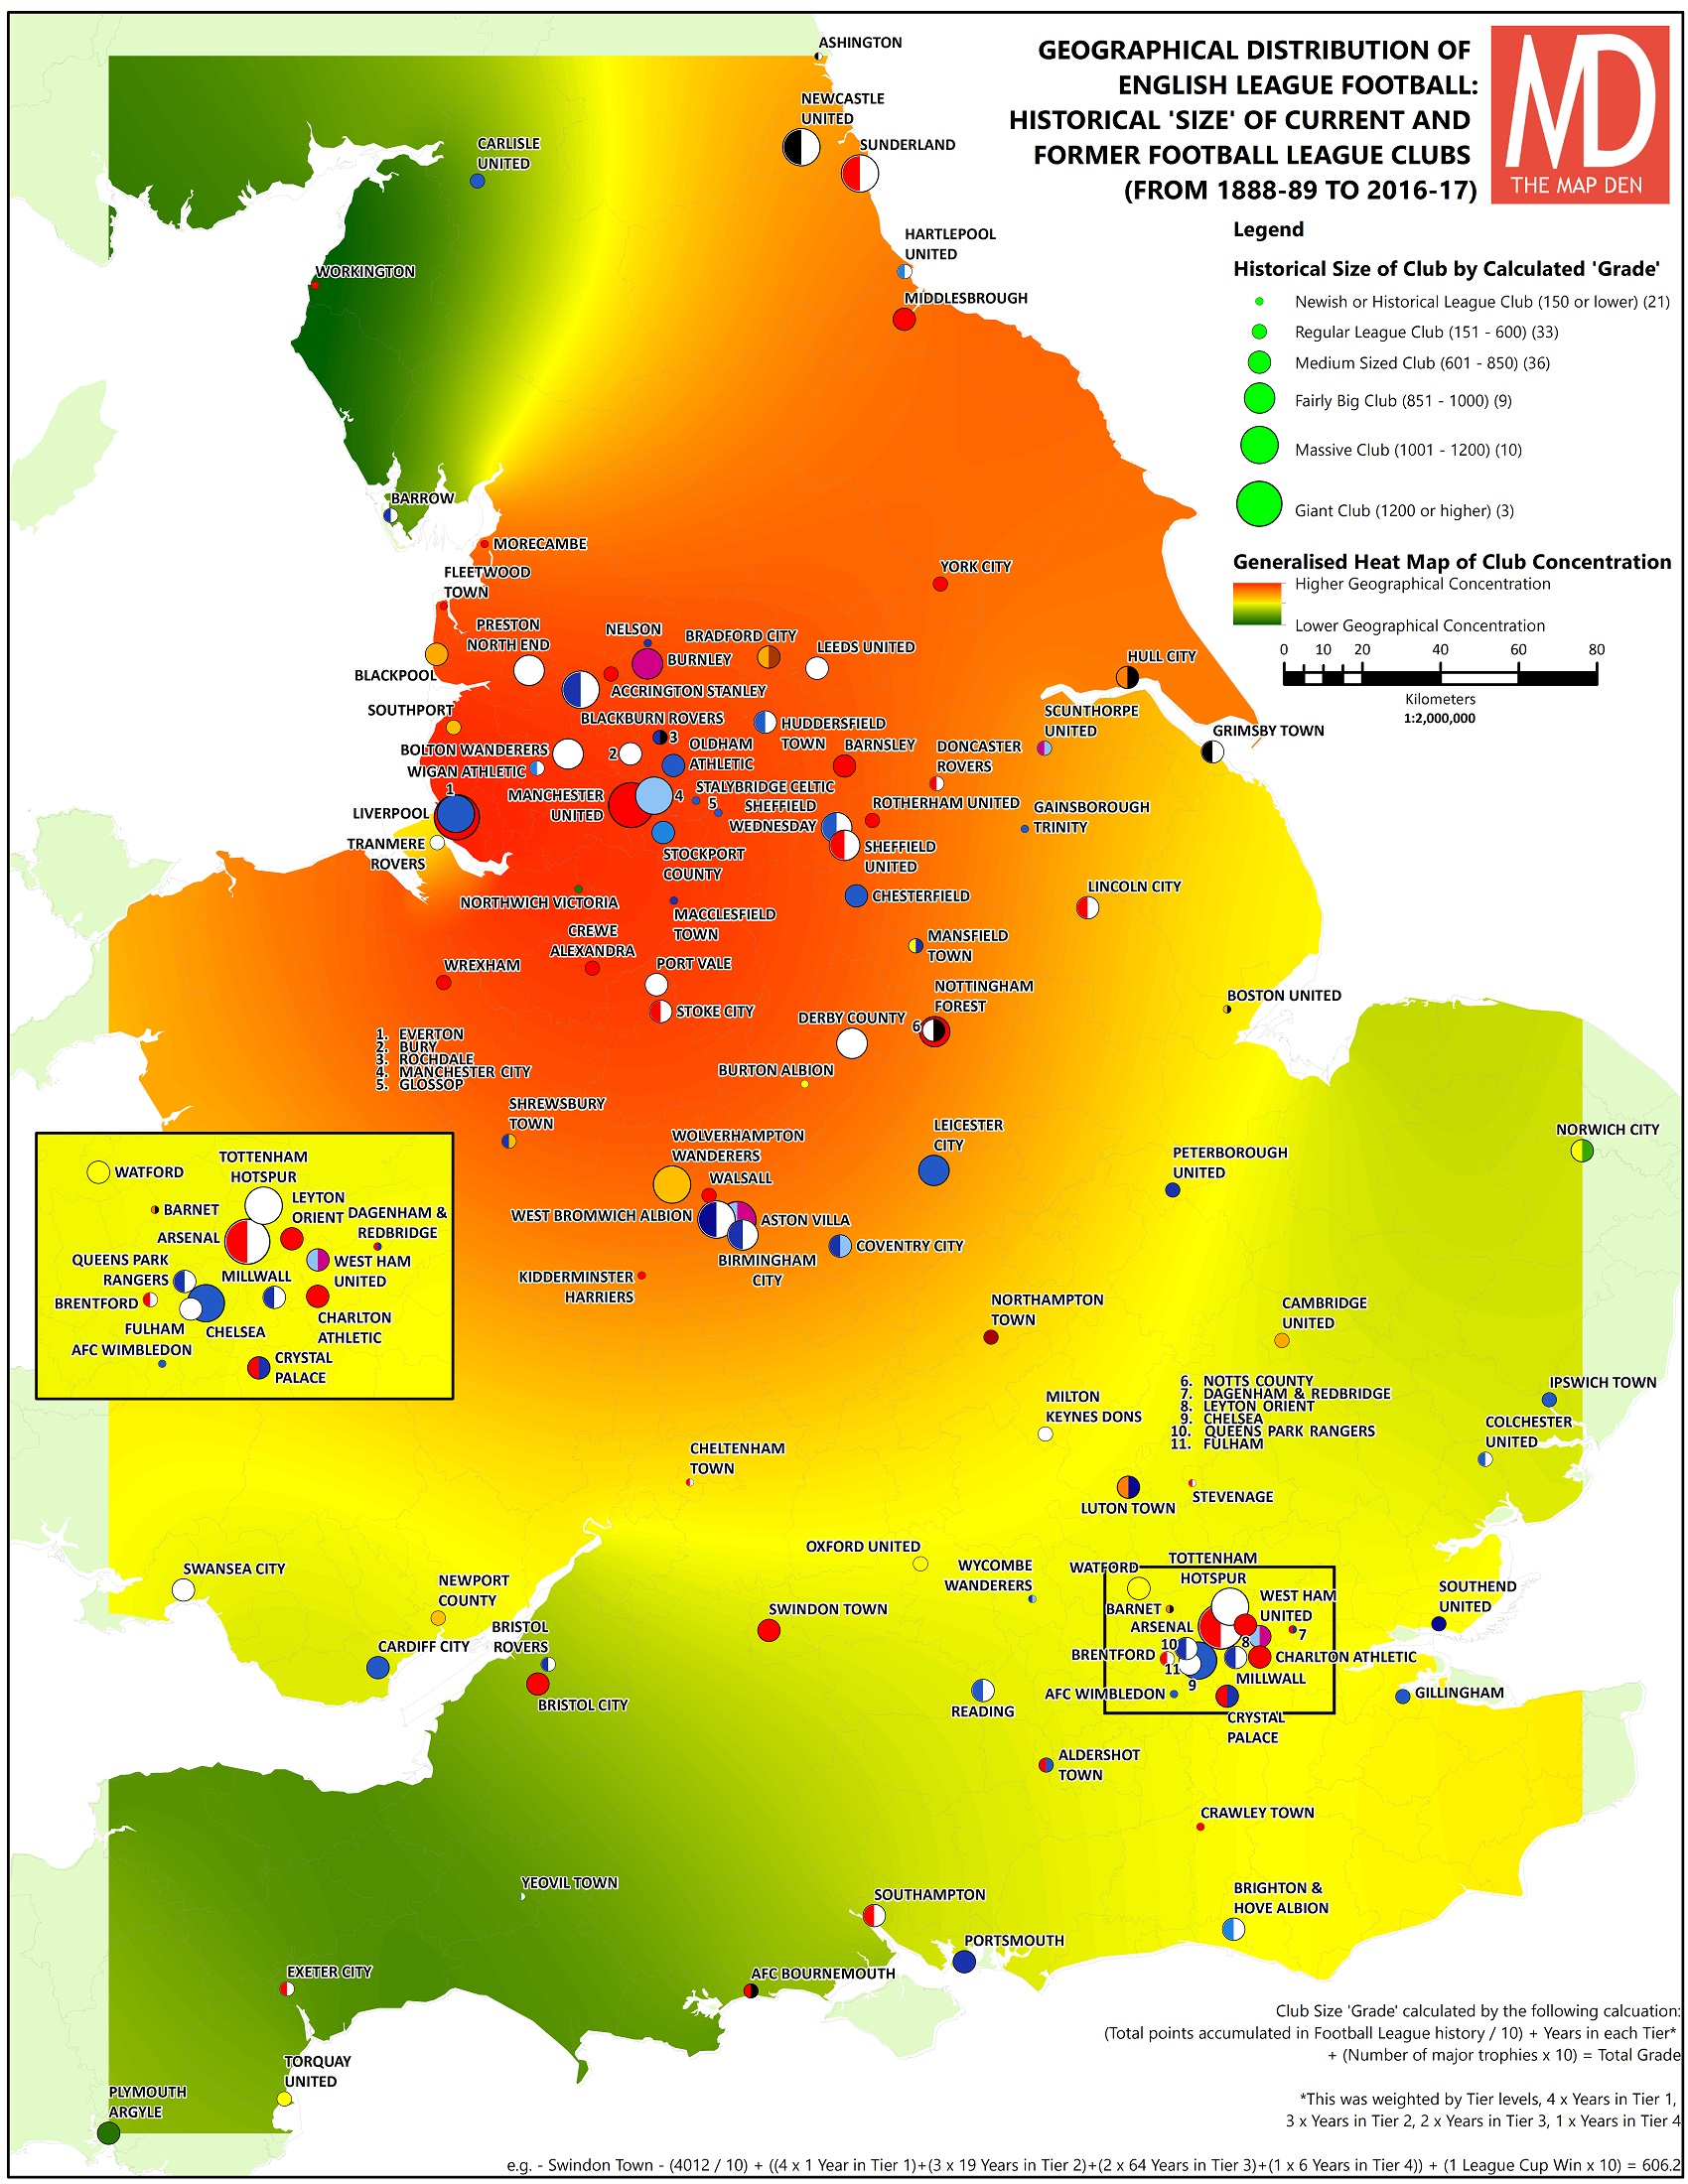
England is often known as the ‘home of football’ due to the its role formalising the first standardised rules of ‘association football’, and this game that was spread globally over the 19th and 20th century. In its early origins in England , the Football Association was formed in 1863, which formalised the rules of the game and started the FA Cup in 1871, but football remained an ad-hoc amateur game, run by those who could afford to play this as a pastime. For example, the majority of founding FA clubs were private school teams, despite the large popularity of the game in the industrialised inner cities of Victorian Britain.

Things began to change with the professionalisation of game following the formation of the Football League in Manchester in 1888, the beating heart of the industrial revolution. All the original 12 members were professionals from the Midlands or North West of England, marking a shift in the game from the amateur clubs, who won the majority of the FA Cups until this point, to be a game for the working classes of the industrialised inner city. Clubs in the Football League onward were dispersed more evenly in the country, but the level of competitiveness, attachment to city/town identity and support of Football League clubs, at relatively low level of the English (& Welsh) game remains unique in comparison to other nations.
The geography (see above) of this is an interesting reflection and history of population density and industrial and post-industrial Britain. Sure, the game now is less affordable for the average income of most people, but it continues to reflect the social history of the UK. The maps and geographical analysis I have created for this blog post look to explore and reflect the patterns of this and other insights.

One can see in the above two maps the concentration of the historical and current football league clubs, as well as ‘success’, in the old industrial North West, Midlands and North East, although one can not ignore the concentration of clubs and historic success in London as well. In the ‘heat map’ above, the areas of higher concentration could easily be confused with the common cultural dividing line between The North and South, or the traditional political voting patterns of UK. I also thought it interesting to investigate the nearest Football League club for each Lower Super Output Area in UK (see below).

This ‘colourful’ and (maybe migrane inducing) map, I find geographically interesting as firstly it shows your nearest Football League club and hinterlands and boundaries of support, drawing inspiration from this awesome map. Another interesting insight is that it also shows some of the lack of geographical logic to football club support. While there are those particularly geographic local links to their club, big clubs like Manchester United, Liverpool, Arsenal, Spurs for example have support bases far beyond their geographically logical areas. Additionally, one would imagine despite the large ‘catchment’ of clubs like Shrewsbury Town, one doubts many in North Wales would be fans of the Shrews; if anything a smaller catchments in crowded cities can reflect greater geographical spread of support ironically. It shows how culture and particularly football support while following some geographical logic, it is in other ways an illogical matter of the heart.
Happy Mapping,
David
PS: For those interested the Football League club records and ‘Grade’ calculations, the data is available here. The historic Football League clubs, include any which still exist as the same club, rather than those who have been re-founded, e.g. Darlington 1883. The ‘Grade’ calculations aren’t a perfect assessment of ‘club size’, but takes into account numbers of years at different Football League levels, points accumulated and major trophies won. This used this following calculation:
(Total points accumulated in Football League history / 10) + Years in each Tier* + (Number of major trophies x 10) = Total Grade
*This was weighted by Tier levels, 4 x Years in Tier 1, 3 x Years in Tier 2, 2 x Years in Tier 3, 1 x Years in Tier 4
e.g. – Swindon Town : (4012 / 10) + ((4 x 1 Year in Tier 1)+(3 x 19 Years in Tier 2)+(2 x 64 Years in Tier 3)+(1 x 6 Years in Tier 4)) + (1 League Cup Win x 10) = 606.2